Boids
To get started with agent-based modelling, we’ll recreate the classic Boids simulation of flocking behavior. This is a relatively simple example but it produces very pleasing visualizations.
Setup
I’m assuming you’ve read through the material in
getting started and are working in your
vivarium_examples package. If not, you should go there first.
Todo
package setup with __init__ and stuff
Building a population
In many ways, this is a bad place to start. The population component is one of the more complicated components in a simulation as it typically is responsible for bootstrapping some of the more interesting features in Vivarium. What we’ll do is start with a simple population and revisit this component as we wish to add more complexity.
~/code/vivarium_examples/boids/population.pyimport numpy as np
import pandas as pd
class Population:
configuration_defaults = {
"population": {
"colors": ["red", "blue"],
}
}
def __init__(self):
self.name = "population"
def setup(self, builder):
self.colors = builder.configuration.population.colors
columns_created = ["color", "entrance_time"]
builder.population.initializes_simulants(
self.on_initialize_simulants, columns_created
)
self.population_view = builder.population.get_view(columns_created)
def on_initialize_simulants(self, pop_data):
new_population = pd.DataFrame(
{
"color": np.random.choice(self.colors, len(pop_data.index)),
"entrance_time": pop_data.creation_time,
},
index=pop_data.index,
)
self.population_view.update(new_population)
Here we’re defining a component that generates a population of 1000 birds. Those birds are then randomly chosen to be either red or blue.
Let’s examine what’s going on in detail, as you’ll see many of the same patterns repeated in later components.
Imports
import numpy as np
import pandas as pd
NumPy is a library for doing high performance
numerical computing in Python. pandas is a set
of tools built on top of numpy that allow for fast
database-style querying and aggregating of data. Vivarium uses
pandas.DataFrame objects as it’s underlying representation of the
population and for many other data storage and manipulation tasks.
By convention, most people abbreviate these packages as np and pd
respectively, and we’ll follow that convention here.
Population class
Vivarium components are expressed as Python classes. You can find many resources on classes and object-oriented programming with a simple google search. We’ll assume some fluency with this style of programming, but you should be able to follow along with most bits even if you’re unfamiliar.
Configuration defaults
In most simulations, we want to have an easily tunable set up knobs to adjust
various parameters. vivarium accomplishes this by pulling those knobs out as
configuration information. Components typically expose the values they use in
the configuration_defaults class attribute.
class Population:
    configuration_defaults = {
        "population": {
            "colors": ["red", "blue"],
        }
    }

    def __init__(self):
We’ll talk more about configuration information later. For now observe that we’re exposing the size of the population that we want to generate and a set of possible colors for our birds.
The setup method
Almost every component in vivarium will have a setup method. The setup method
gives the component access to an instance of the
Builder which exposes a handful of tools
to help build components. The simulation framework is responsible for calling
the setup method on components and providing the builder to them. We’ll
explore these tools that the builder provides in detail as we go.
1
2def setup(self, builder):
3    self.colors = builder.configuration.population.colors
4
5    columns_created = ["color", "entrance_time"]
6    builder.population.initializes_simulants(
Our setup method is doing three things.
First, it’s accessing the subsection of the configuration that it cares about
(line ). The full simulation configuration is available from the builder as
builder.configuration. You can treat the configuration object just like
a nested python
dictionary
that’s been extended to support dot-style attribute access. Our access here
mirrors what’s in the configuration_defaults at the top of the class
definition.
Next, we interact with the vivarium’s population management system.
Note
The Population Table
When we talk about columns in the context of Vivarium, we are typically talking about the simulant attributes. Vivarium represents the population of simulants as a single pandas DataFrame. We think of each simulant as a row in this table and each column as an attribute of the simulants.
In line 4 we create a variable to hold the names of the columns we want to
create and in line 5 we tell the simulation that any time new people get added
to the simulation from any component the framework should call the
on_initialize_simulants function in this component to set the
'entrance_time' and 'color' columns for each new simulant.
We’ll see a third argument for this function soon and discuss the population management system in more detail.
Next in line 6 we get a view into the population table.
Population views are
used both to query the current state of simulants and to update that state
information. When you request a population view from the builder, you must
tell it which columns in the population table you want to see, and so here we
pass along the same set of columns we’ve said we’re creating.
The on_initialize_simulants method
Finally we look at the on_initialize_simulants method. You can name this
whatever you like in practice, but I have a tendency to give methods that the
framework is calling names that describe where in the simulation life-cycle
they occur. This helps me think more clearly about what’s going on and helps
debugging.
1    )
2    self.population_view = builder.population.get_view(columns_created)
3
4def on_initialize_simulants(self, pop_data):
5    new_population = pd.DataFrame(
6        {
We see that like the setup method, on_initialize_simulants takes in a
special argument that we don’t provide. This argument, pop_data is an
instance of SimulantData containing a
handful of information useful when initializing simulants.
The only two bits of information we need for now are the
pop_data.index, which supplies the index of the simulants to be
initialized, and the pop_data.creation_time which gives us a
representation (typically an int or pandas.Timestamp) of the
simulation time when the simulant was generated.
Note
The Population Index
The population table we described before has an index that uniquely identifies each simulant. This index is used in several places in the simulation to look up information, calculate simulant-specific values, and update information about the simulants’ state.
Using the population index, we generate a pandas.DataFrame on lines 2-5
and fill it with the initial values of ‘entrance_time’ and ‘color’ for each
new simulant. Right now, this is just a table with data hanging out in our
simulation. To actually do something, we have to tell the population
management system to update the underlying population table, which we do
on line 6.
Putting it together
Vivarium supports both a command line interface and an interactive one. We’ll look at how to run simulations from the command line later. For now, we can set up our simulation with the following code:
from vivarium import InteractiveContext
from vivarium_examples.boids.population import Population

sim = InteractiveContext(components=[Population()])

# Peek at the population table
print(sim.get_population().head())
   tracked entrance_time color
0     True    2005-07-01  blue
1     True    2005-07-01   red
2     True    2005-07-01   red
3     True    2005-07-01   red
4     True    2005-07-01   red
Position
The classic Boids model introduces three steering behaviors into a population of birds and simulates their resulting behavior. For this to work, we need to track the position and velocity of our birds, so let’s start there.
~/code/vivarium_examples/boids/location.pyclass Location:
configuration_defaults = {
"location": {
"width": 1000, # Width of our field
"height": 1000, # Height of our field
}
}
def __init__(self):
self.name = "location"
def setup(self, builder):
self.width = builder.configuration.location.width
self.height = builder.configuration.location.height
columns_created = ["x", "vx", "y", "vy"]
builder.population.initializes_simulants(self.on_create_simulants, columns_created)
self.population_view = builder.population.get_view(columns_created)
def on_create_simulants(self, pop_data):
count = len(pop_data.index)
# Start clustered in the center with small random velocities
new_population = pd.DataFrame(
{
"x": self.width * (0.4 + 0.2 * np.random.random(count)),
"y": self.height * (0.4 + 0.2 * np.random.random(count)),
"vx": -0.5 + np.random.random(count),
You’ll notice that this looks very similar to our initial population model. Indeed, we can split up the responsibilities of initializing simulants over many different components. In Vivarium we tend to think of components as being responsible for individual behaviors or attributes. This makes it very easy to build very complex models while only having to think about local pieces of it.
Let’s add this component to our model and look again at the population table.
from vivarium import InteractiveContext
from vivarium_examples.boids.population import Population
from vivarium_examples.boids.location import Location

sim = InteractiveContext(components=[Population(), Location()])

# Peek at the population table
print(sim.get_population().head())
      tracked           x           y        vx        vy entrance_time color
0     True  458.281179  463.086940 -0.473012  0.355904    2005-07-01  blue
1     True  480.864694  596.290448 -0.058006 -0.241146    2005-07-01   red
2     True  406.092503  533.870307  0.299711 -0.041151    2005-07-01  blue
3     True  444.028917  497.491363 -0.005976 -0.491665    2005-07-01   red
4     True  487.670224  412.832049 -0.145613 -0.123138    2005-07-01  blue
Our population now has initial position and velocity!
Visualizing our population
Now is also a good time to come up with a way to plot our birds. We’ll later use this to generate animations of our birds flying around. We’ll use matplotlib for this.
Making good visualizations is hard, and beyond the scope of this tutorial, but
the matplotlib documentation has a large number of
examples and
tutorials that should be
useful.
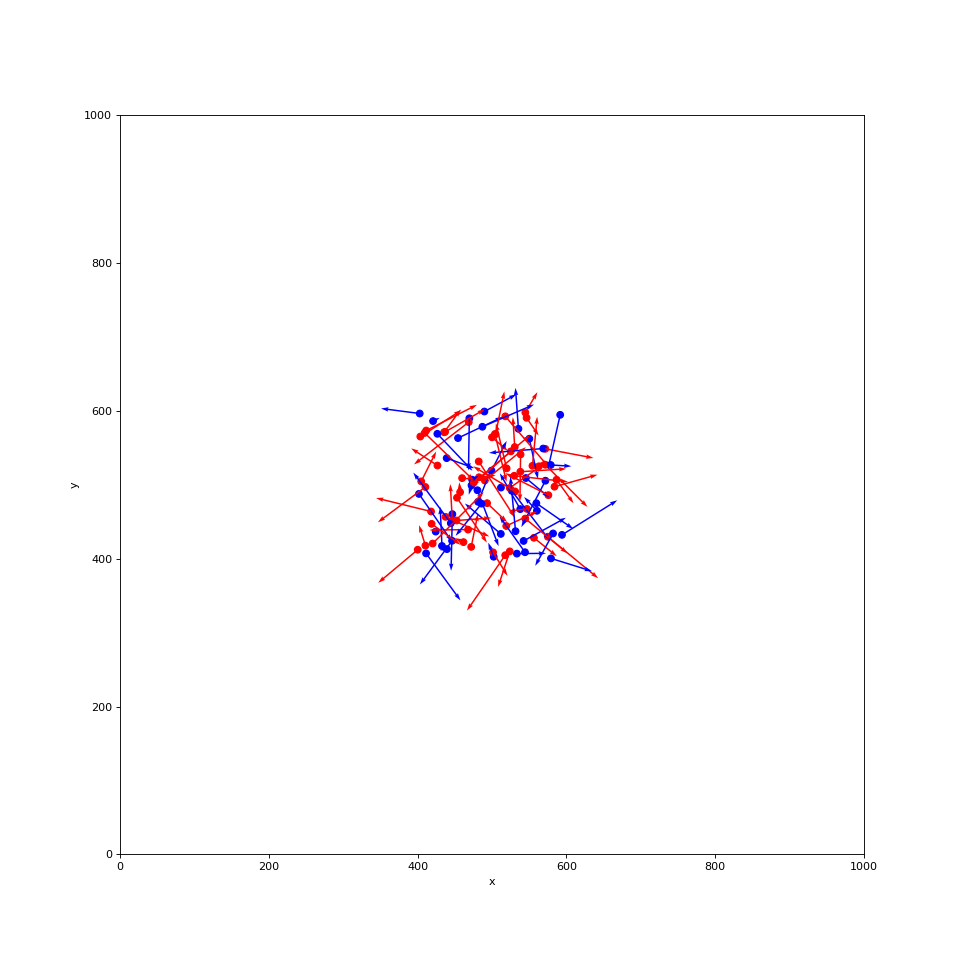
For our purposes, we really just want to be able to plot the positions of our birds and maybe some arrows to indicated their velocity.
~/code/vivarium_examples/boids/visualization.pyimport matplotlib.pyplot as plt
def plot_birds(simulation, plot_velocity=False):
width = simulation.configuration.location.width
height = simulation.configuration.location.height
pop = simulation.get_population()
plt.figure(figsize=[12, 12])
plt.scatter(pop.x, pop.y, color=pop.color)
if plot_velocity:
plt.quiver(pop.x, pop.y, pop.vx, pop.vy, color=pop.color, width=0.002)
plt.xlabel("x")
plt.ylabel("y")
plt.axis([0, width, 0, height])
plt.show()
We can then visualize our flock with
from vivarium import InteractiveContext
from vivarium_examples.boids.population import Population
from vivarium_examples.boids.location import Location
from vivarium_examples.boids.visualization import plot_birds

sim = InteractiveContext(components=[Population(), Location()])

plot_birds(sim, plot_velocity=True)
(Source code, png, hires.png, pdf)
Calculating Neighbors
The steering behavior in the Boids model is dictated by interactions of each bird with its nearby neighbors. A naive implementation of this can be very expensive. Luckily, Python has a ton of great libraries that have solved most of the hard problems.
Here, we’ll pull in a KDTree from SciPy and use it to build a component that tells us about the neighbor relationships of each bird.
~/code/vivarium_examples/boids/neighbors.pyimport pandas as pd
from scipy import spatial
class Neighbors:
configuration_defaults = {"neighbors": {"radius": 10}}
def __init__(self):
self.name = "Neighbors"
def setup(self, builder):
self.radius = builder.configuration.neighbors.radius
self.neighbors_calculated = False
self._neighbors = pd.Series()
self.neighbors = builder.value.register_value_producer(
"neighbors", source=self.get_neighbors
)
builder.population.initializes_simulants(self.on_create_simulants)
self.population_view = builder.population.get_view(["x", "y"])
builder.event.register_listener("time_step", self.on_time_step)
def on_create_simulants(self, pop_data):
self._neighbors = pd.Series([[]] * len(pop_data.index), index=pop_data.index)
def on_time_step(self, event):
self.neighbors_calculated = False
def get_neighbors(self, index):
if not self.neighbors_calculated:
self.calculate_neighbors()
return self._neighbors[index]
def calculate_neighbors(self):
# Reset our list of neighbors
pop = self.population_view.get(self._neighbors.index)
self._neighbors = pd.Series([[]] * len(pop), index=pop.index)
tree = spatial.KDTree(pop)
# Iterate over each pair of simulates that are close together.
for boid_1, boid_2 in tree.query_pairs(self.radius):
# .iloc is used because query_pairs uses 0,1,... indexing instead of pandas.index
self._neighbors.iloc[boid_1].append(self._neighbors.index[boid_2])
self._neighbors.iloc[boid_2].append(self._neighbors.index[boid_1])
Todo
Describe rationale for neighbors component
Start building behavior components
Build animation component